The TensorZero Gateway can export traces to an external OpenTelemetry-compatible observability system using OTLP. Exporting traces via OpenTelemetry allows you to monitor the TensorZero Gateway in external observability platforms such as Jaeger, Datadog, or Grafana. This integration enables you to correlate gateway activity with the rest of your infrastructure, providing deeper insights and unified monitoring across your systems. Exporting traces via OpenTelemetry does not replace the core observability features built into TensorZero. Many key TensorZero features (including optimization) require richer observability data that TensorZero collects and stores in your database. Traces exported through OpenTelemetry are for external observability only.Documentation Index
Fetch the complete documentation index at: https://www.tensorzero.com/docs/llms.txt
Use this file to discover all available pages before exploring further.
Configure
Set up the configuration
Enable
export.otlp.traces.enabled in the [gateway] section of the tensorzero.toml configuration file:Configure the OTLP traces endpoint
Set the
OTEL_EXPORTER_OTLP_TRACES_ENDPOINT environment variable in the gateway container to the endpoint of your OpenTelemetry service.TensorZero only supports gRPC endpoints for OTLP trace export. HTTP endpoints
are not supported.
Example: TensorZero Gateway and Jaeger with Docker Compose
Example: TensorZero Gateway and Jaeger with Docker Compose
For example, if you’re deploying the TensorZero Gateway and Jaeger in Docker Compose, you can set the following environment variable:
Browse the exported traces
Once configured, the TensorZero Gateway will begin sending traces to your OpenTelemetry-compatible service.Traces are generated for each HTTP request handled by the gateway (excluding auxiliary endpoints).
For inference requests, these traces additionally contain spans that represent the processing of functions, variants, models, and model providers.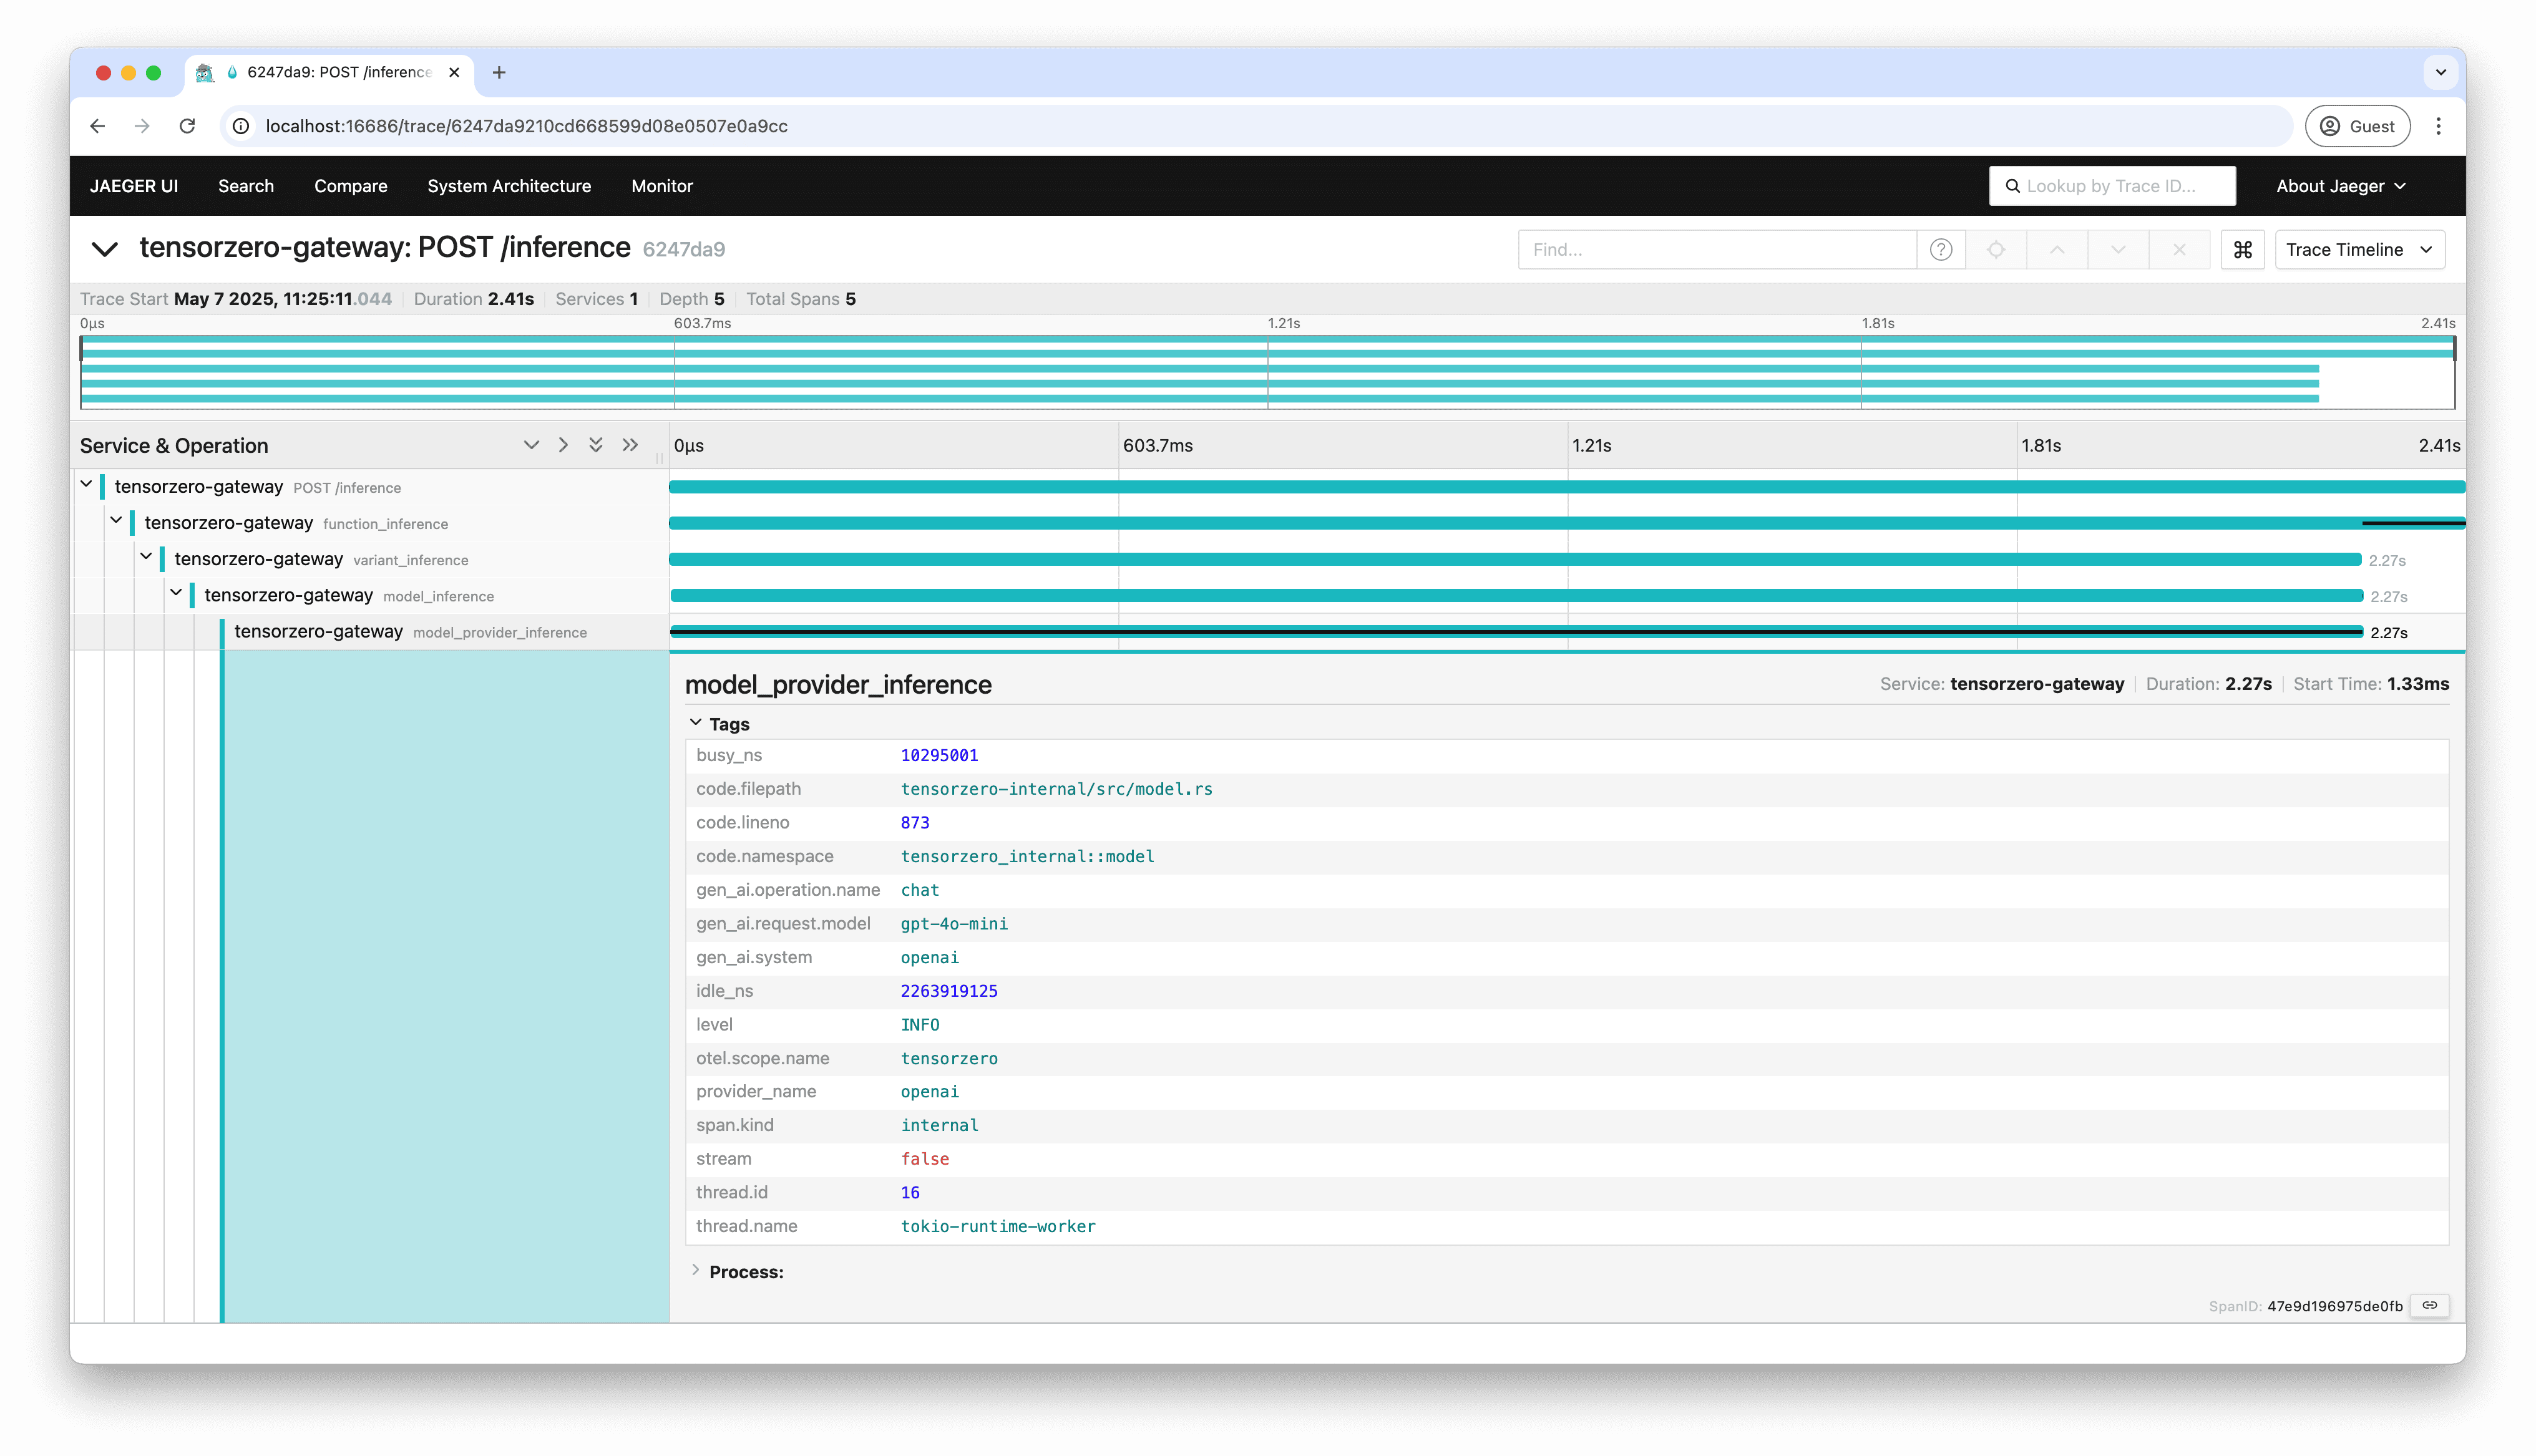
Customize
Send custom HTTP headers
You can attach custom HTTP headers to the outgoing OTLP export requests made toOTEL_EXPORTER_OTLP_TRACES_ENDPOINT.
Define custom headers in the configuration
You can configure static headers that will be included in all OTLP export requests by adding them to theexport.otlp.traces.extra_headers field in your configuration file:
tensorzero.toml
Define custom headers during inference
You can also send custom headers dynamically on a per-request basis. When there is a conflict between static and dynamic headers, the latter takes precedence.- Python (OpenAI SDK)
- Node (OpenAI SDK)
- HTTP
When using the OpenAI Python SDK with the TensorZero OpenAI-compatible endpoint, you can pass dynamic OTLP headers using the This will attach the headers
extra_headers parameter.
You must prefix header names with tensorzero-otlp-traces-extra-header-:user-id: user-123 and request-source: mobile-app when exporting any span associated with that specific inference request.Send custom OpenTelemetry attributes
You can attach custom span attributes to OTLP trace exports. The values must be valid JSON; TensorZero currently supports strings and booleans only.- Python (OpenAI SDK)
- HTTP
When using the OpenAI Python SDK with the TensorZero OpenAI-compatible endpoint, you can pass custom attributes using the
extra_headers parameter.
You must prefix header names with tensorzero-otlp-traces-extra-attribute-:Send custom OpenTelemetry resources
You can attach custom resource attributes to OTLP trace exports.- Python (OpenAI SDK)
- HTTP
When using the OpenAI Python SDK with the TensorZero OpenAI-compatible endpoint, you can pass custom resources using the
extra_headers parameter.
You must prefix header names with tensorzero-otlp-traces-extra-resource-:Link to existing traces with traceparent
TensorZero automatically handles incoming traceparent headers for distributed tracing when OTLP is enabled.
This follows the W3C Trace Context standard.
Export OpenInference traces
By default, TensorZero exports traces with attributes that follow the OpenTelemetry Generative AI semantic conventions. You can instead choose to export traces with attributes that follow the OpenInference semantic conventions by settingexport.otlp.traces.format = "openinference" in your configuration file.
See Configuration Reference for more details.